
Oh How the Charts Can Lie. Deconstructing Backtests.

Investing can feel that way too. Every chart wants your attention, every strategy wants to look like the biggest and best answer, and the real work is learning how to cut through the noise to find what we're actually looking for.
"If you torture the data long enough, it will confess."
Ronald Coase
I don't know where you are in your investing journey. I only know where I am in mine. My goal with this article is simple. I hope you find something in it that feels familiar, resonates, or at the very least causes you to pause when the results look too good to be true.
When I really started researching and scouring the Internet and books for investment strategies that moved the needle and produced alpha, I noticed a pattern. I would get pulled deep into an article, only to realize the amazing chart was doing a lot more selling than explaining.
Most of the time, that proof had a name. A backtest.
So let's talk about what a backtest is, what makes one trustworthy, and what should make us slow down before trusting the chart.
The answers matter because they shape whether a strategy is worth our time, attention, and hard-earned cash.
In investing, a backtest uses hindsight to test a strategy by going back in time and replaying history to see how that strategy would have worked. It's a brilliantly powerful concept, and it's very easy to implement wrong.
The number one rule is honesty. The backtest must be honest. During the design of the test, decisions can only use information that would have been known at that moment in history.
If tomorrow's information sneaks into yesterday's decision, the test is broken. That's look-ahead bias.
Another trap is overfitting. That's when a strategy is tuned so tightly to the past that it starts memorizing history instead of learning from it. One way to fight that is perturbation testing. Change the inputs a little. Shift the dates. Nudge the assumptions. If a strategy falls apart because one setting moved, that's not confidence. That's a house of cards waiting to crumble.
The next requirement is clean data. The data we use to reconstruct the past needs to reflect what actually happened. That sounds simple. It gets harder the further back you go.
Maybe one provider has some of the history, but you need more. So you buy older data from another provider. Maybe that provider has some of what you need, but not all of it. So you search again. Now you have data from multiple places. What happens if it doesn't all line up?
We are testing a decision-making process, and that process only knows what the data tells it. If the data is wrong, the strategy may look smarter than it is.
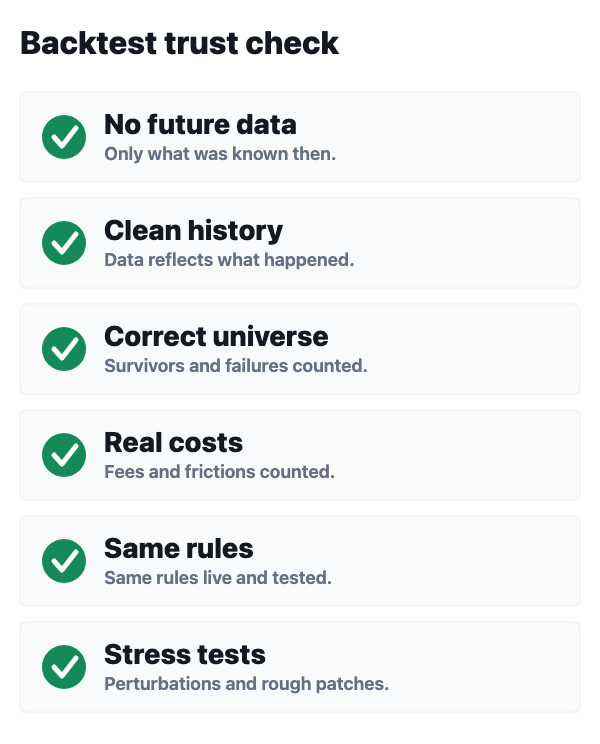
Next comes survivorship bias. This happens when the group of investments being tested includes only the ones that survived.
For example, imagine testing a strategy against today's index members over a long historical period. That sounds reasonable until you realize today's list includes companies that made it. The failures, removals, acquisitions, and disappearances may be missing.
That gives the test an advantage it wouldn't have had in real time. A better test uses point-in-time membership where available, so the model isn't pretending today's winners were always there.
Companies come and go. They fail. They merge. They get bought out. Sometimes they return to being private companies. All of that creates opportunities for the data to be missing, mismatched, or incomplete.
Time windows matter too. A strategy tested only during a strong bull market has not been through much of a fight.
If it works in bull markets but not bear markets, that may still be useful. It just needs to be disclosed.
Duration matters for the same reason. The longer the test, the more market conditions it has to survive. Bear markets. Bull markets. Sideways markets. Choppy markets. The longer the better.
Averages can hide a lot of pain. I care less about one pretty number for the full period and more about how the strategy behaves in rough patches. What happened in crashes? Long sideways stretches? Bad years? The months when the market seems to wake up early just to test your commitment?
I can't stand seeing an excellent chart only to find out the test covered a short stretch of friendly market conditions. That's not much pressure.
Real-world costs belong in the test too. Fees, slippage, and taxes can change the story fast. A strategy that works well inside retirement accounts may look different in a taxable account. That drag can be large enough to matter, so the assumptions need to be stated clearly and included in the calculations.
Benchmark comparisons need clear labels too. Price return and total return aren't the same thing. A chart should tell you which one you are looking at before asking you to trust it.
If a strategy has rules for when to stay invested, rebalance, reduce exposure, or step aside, those rules need to be part of the test. Otherwise the chart is showing an incomplete picture of what an investor would actually experience. That may look better on paper, but paper is very patient.
Lastly, disclose the quality of the data. If there are known issues, say so. Don't leave them out. Don't cover up bad numbers. Don't manipulate the data or the rules to make the chart look better.
If you can understand the intention behind the backtest, you can often understand whether the author is trying to test a strategy or sell you a story.
When I was designing my current investment strategy, it was for me and me alone. So I wanted to be as honest with myself as possible.
If I found a data issue, logic issue, or any issue at all, I worked through it and tested again. My full 30-year backtest takes about 17 hours to run. That creates plenty of waiting around, second guessing, coffee, and muttering at screens.
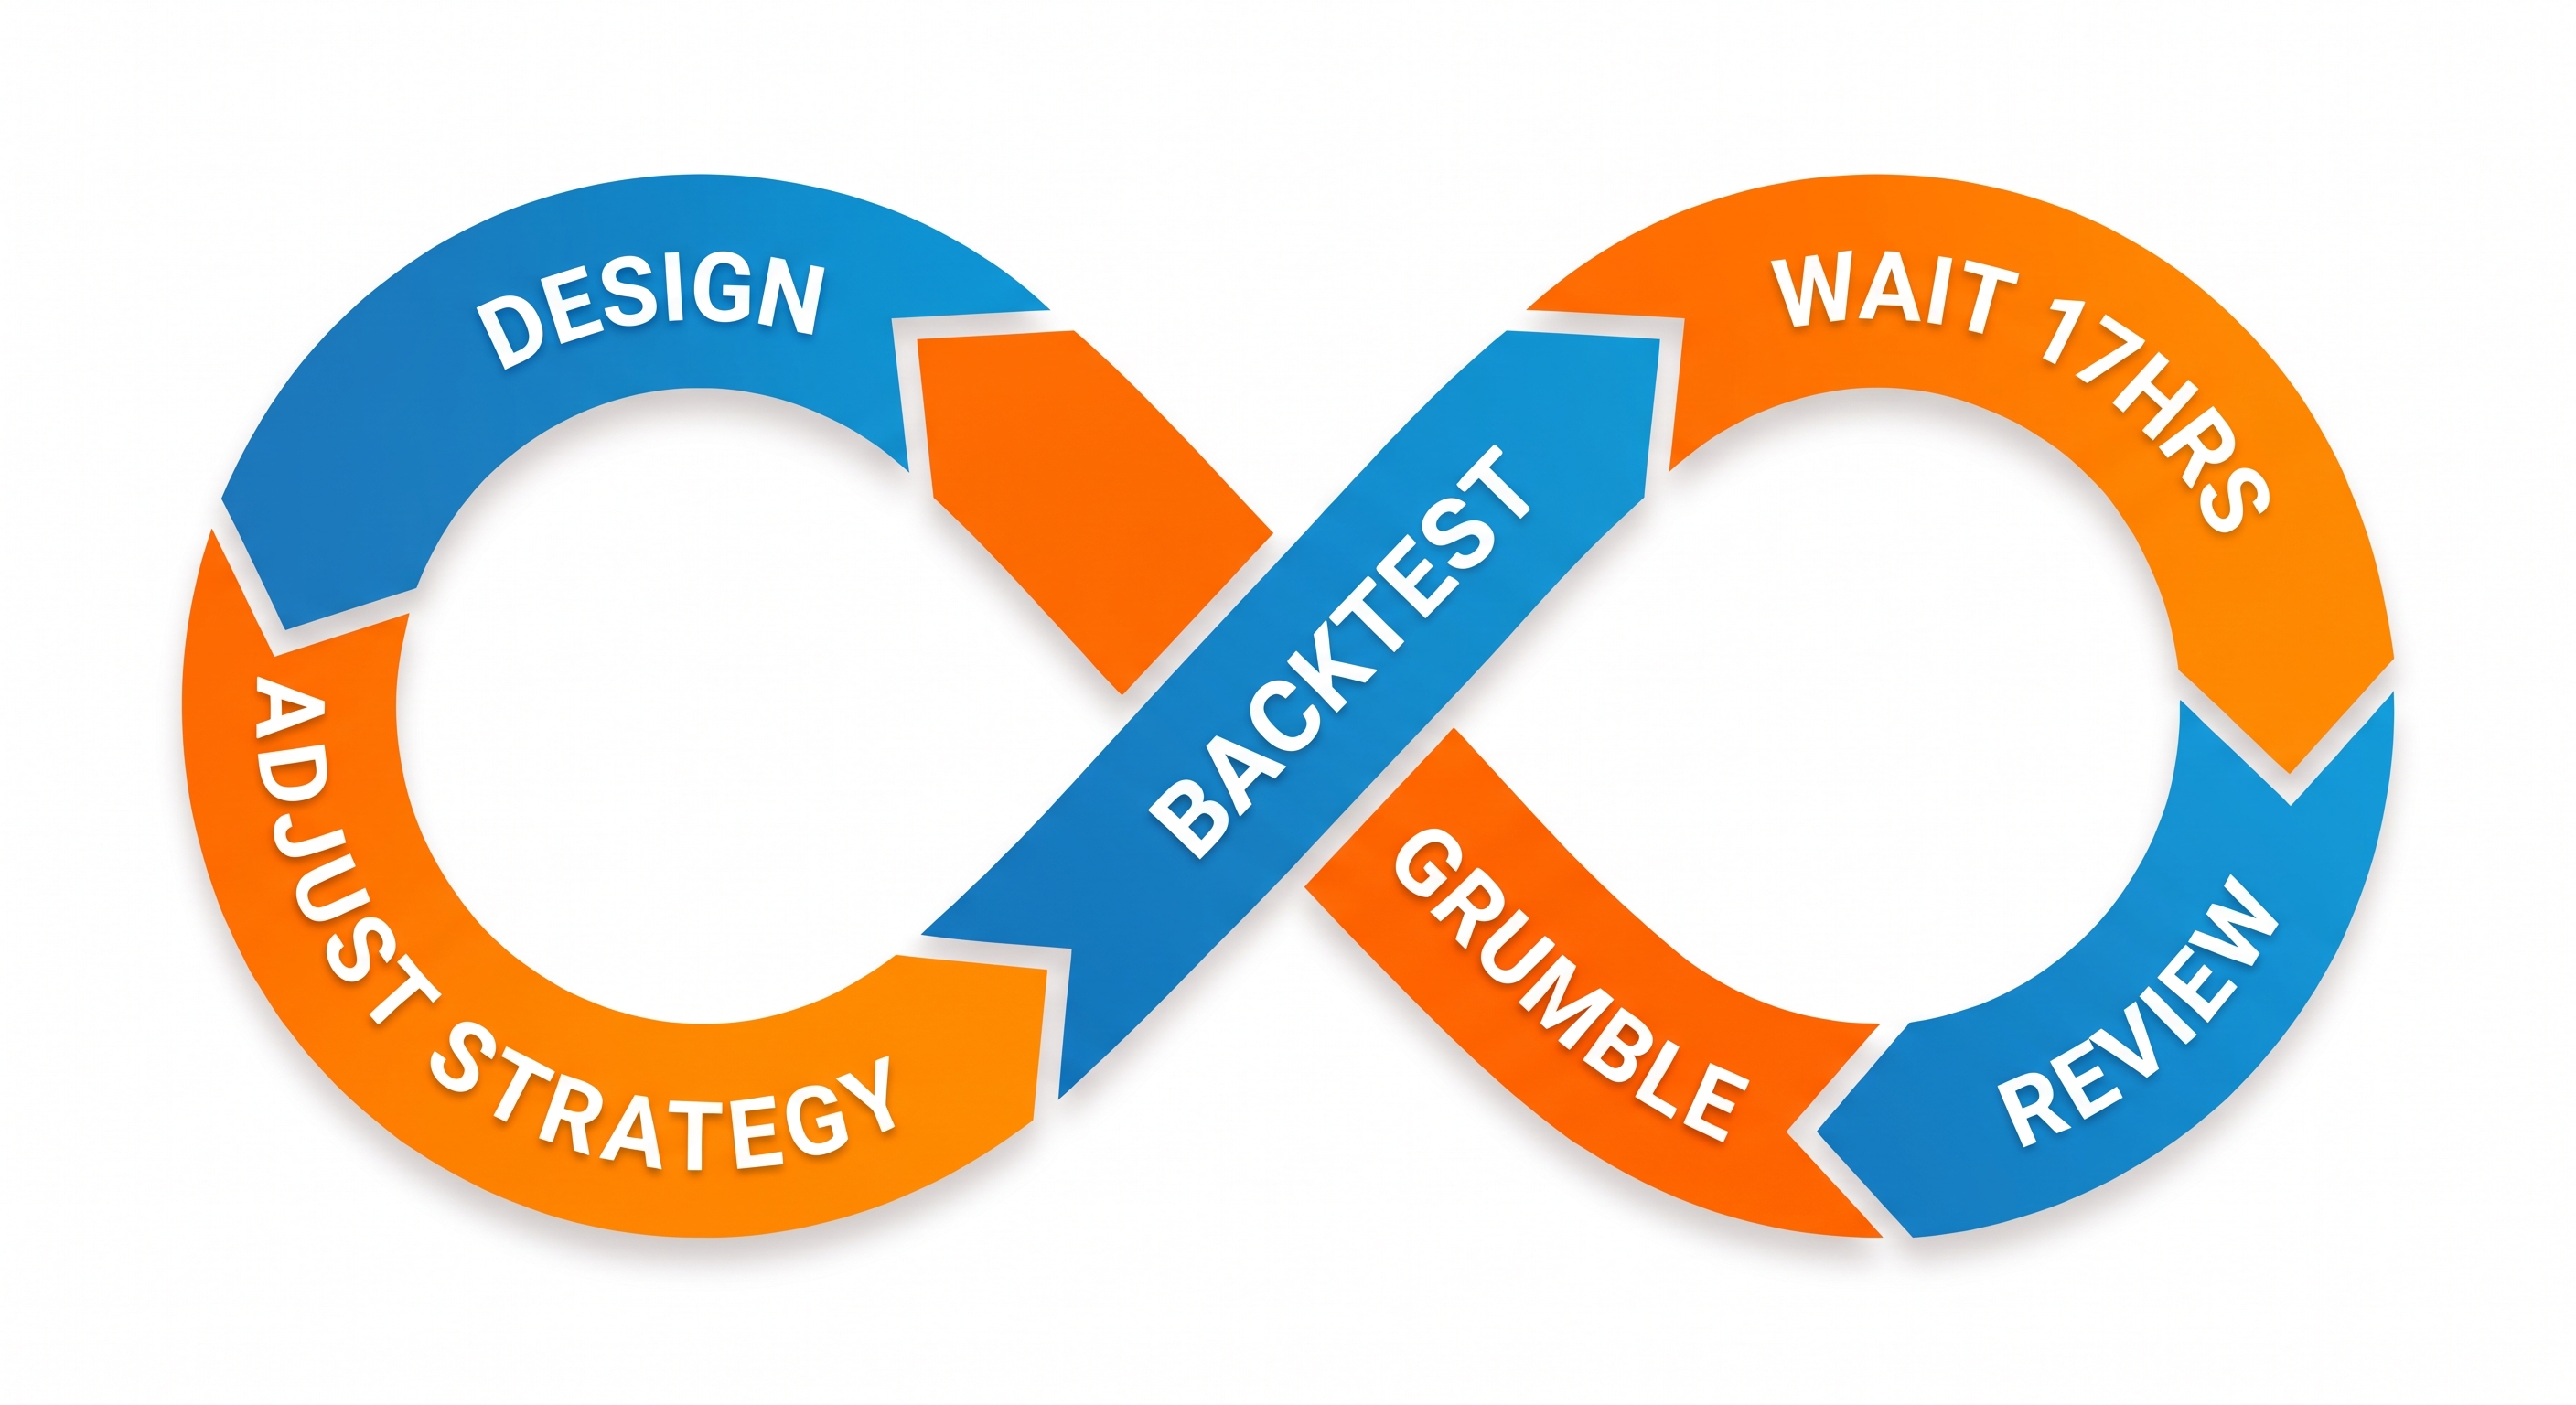
But these were my retirement accounts and my brokerage account. They would bear the cost of mistakes and miscalculations. So the extra work mattered. I wanted the test to earn my trust before my money had to live with the results.
A good backtest does not prove the future. It gives you a cleaner way to ask whether an idea deserves live testing.
It wasn't until after I implemented the strategy and saw the results with my own eyes in my own accounts that I decided it was something I wanted to share with others.
Since I'm customer number one, I certainly don't want any corners cut or mistakes made.
For advisors, CFPs, and RIAs, I think the same standard applies. Before a model deserves serious attention, the evidence should be clear enough to inspect and question.
A strategy can be good and still be wrong for you. If the drawdowns make you abandon it, the concentration keeps you up, or the rules don't match how you think, it's probably better to walk away than force it. The best strategy is the one you can actually stick with when it stops being fun.
If you want to dig into the numbers, the evidence page is where I publish the public record, methodology links, and performance context.
If you'd like to follow along, sign up for free, paper trade side-by-side, and see what you think. If the approach fits how you think, you can decide from there.
I am the founder of Starting Index and have a financial interest in the platform. This article is for informational and educational purposes only and is not personalized investment advice. Backtests are hypothetical and do not guarantee future results. Investing involves risk, including loss of principal.