
Why Survivorship Bias Can Ruin a Strategy Before It Starts
A closer look at one data problem that can make a backtest look stronger than it would have been in real life.

Digging into a strategy, understanding the methodology in play, and analyzing the results can be fun. Right up until the "proof" turns out to be built on bad data.
It stings to spend a lot of time trying to understand a strategy that looks almost too good to be true, only to find out the underlying data used to "prove" it was bad. We talked about several potential issues with backtests in the previous article, but today I want to focus on one of the sneakiest ones.
Survivorship bias.
That sounds like something that belongs in a statistics textbook, which is unfortunate because that's usually where attention spans go to die. But the concept is simple.
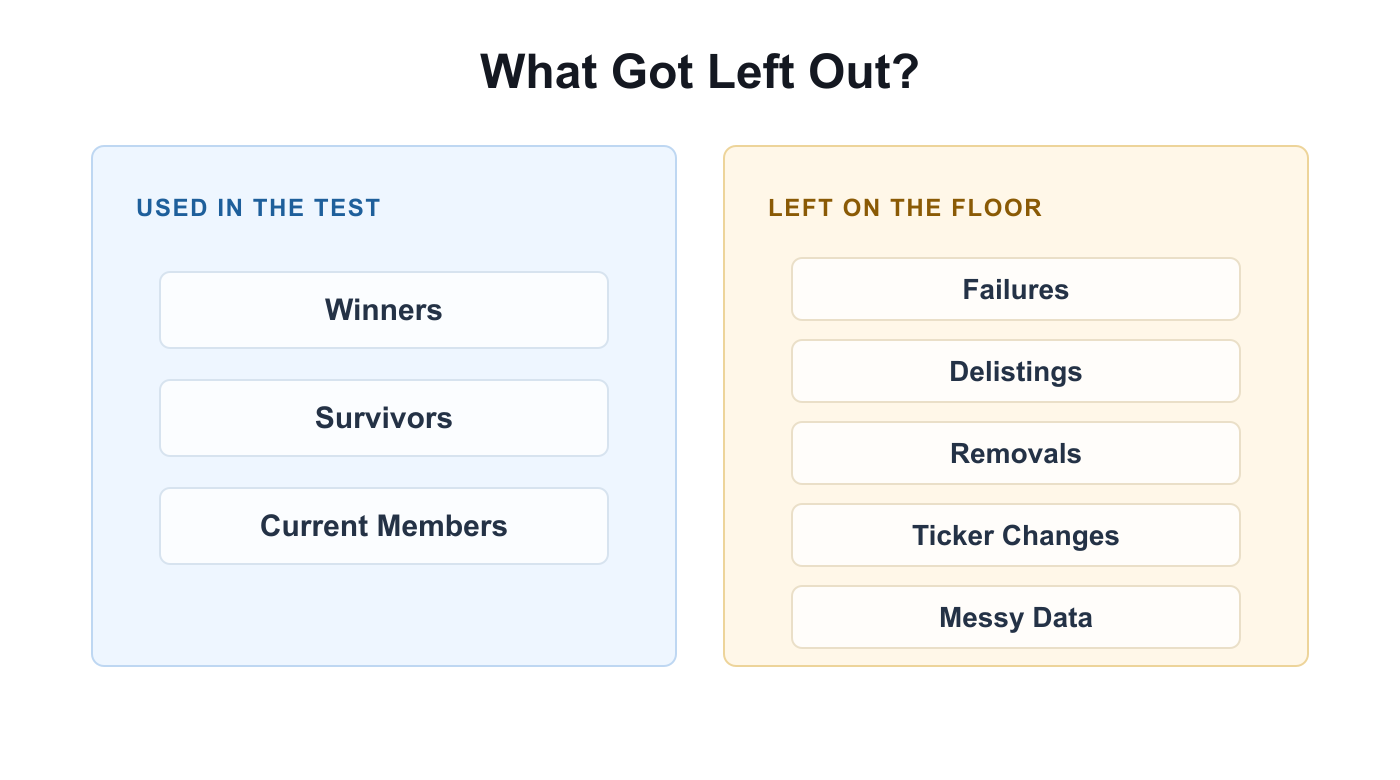
Survivorship bias happens when the test only includes the companies that made it.
That's a problem because the companies that didn't make it still shaped the real investing world at the time. They were on the field. They could have been selected. They could have hurt returns. Leaving them out makes history look cleaner than it was.
The Past Has a Cleanup Crew
Think about a company index like the S&P 500.
The list of companies in the index today isn't the same list from 10, 20, or 30 years ago. Companies get added. Companies get removed. Some fail. Some merge. Some get bought. Some lose relevance and disappear from the index.
If a strategy is tested over 30 years using only today's index members, the test has a problem.
It's pretending today's survivors were available the whole time and somehow always the best choices.
That can make a strategy look much smarter than it would have been in real life. The failures are gone. The weak companies are gone. The companies that got removed before they could do more damage may be gone too.
Now the backtest gets to pick from a cleaned-up version of history.
That's not research. That's a highlight reel.
The Test Needs the Same Choices You Had Then
A useful backtest should try to recreate the decisions an investor could have made at each point in time.
If the strategy is making a decision in March 2008, it should only know what was available in March 2008. It shouldn't know which companies would survive into 2026.
That sounds obvious once stated out loud, but it's easy to get wrong.
Sometimes the data provider only gives you the current list. Sometimes old membership data is incomplete. Sometimes ticker changes, mergers, spin-offs, and delistings make the historical record messy. Sometimes the data exists, but stitching it together is a pain in the arse.
Pain in the arse
Technical term. The frustrating process of stitching together old index membership, ticker changes, mergers, spin-offs, and delistings when all you wanted was a clean answer.
And unfortunately, it matters.
The strategy doesn't just need price history. It needs the correct opportunity set. It needs to know what it could have selected at the time.
Otherwise, the test is using a time machine.
And if I had a working time machine, I would have a lot better things to do than backtest stock strategies. Mostly involving lottery numbers, Apple stock, and helping steer a younger version of me in the right direction before he decided Jams were a good idea (go ahead, take a moment to Google "Jams shorts" if you're under 45).
Why This Can Change the Results
Survivorship bias usually makes results look better than they should.
And not always by a tiny amount.
If the test removes companies that failed, struggled, got acquired after weakness, or were kicked out of an index, the remaining universe can be stronger than the real one. A momentum strategy can look especially good in that kind of setup because it may be selecting from companies that already proved they could survive.
That can inflate returns, reduce drawdowns, make a strategy look more consistent, and make risk look smaller than it was.
And the worst part is that the chart may still look perfectly reasonable. Nothing jumps off the page screaming, "Hey, this result got a head start."
That's why survivorship bias is dangerous. It doesn't always look like fraud or sloppy work. Sometimes it looks like a normal chart with a missing footnote.
The Question I Want Readers to Ask
When I see a backtest now, I care less about the first chart and more about the first few questions.
What data was used?
Was the investment universe reconstructed point in time?
Were removed companies included?
Were ticker changes handled?
Were bankruptcies, acquisitions, and delistings accounted for?
Did the strategy only use information available at the time?
That may sound tedious, but it's the difference between testing a strategy and admiring a story.
I also don't think every backtest with imperfect data is useless. Some tests are still useful for learning, screening, and exploring an idea. They just need to be labeled for what they are.
If the data has limitations, say so.
If the universe is current members only, say so.
If the test is meant to be directional instead of definitive, say so.
The issue isn't imperfection. The issue is pretending imperfection doesn't exist.
Why I Took This Seriously
This mattered to me because I was building a strategy for my own money first.
I wasn't trying to win an argument on the Internet. I was trying to decide whether I trusted a process enough to let it manage real retirement money (my retirement money).
That changes the mood a bit.
If a test looked great only because the bad companies had been scrubbed from the data, I wanted to know that before putting money behind it. I didn't want a beautiful chart built on a fantasy version of the market.
So the goal became simple. Rebuild the investable universe as accurately as possible for each point in time, then let the strategy make its decisions from that universe.
Messier history, fairer test, more useful evidence.
That doesn't make the future knowable. Nothing does. But it does make the evidence more useful.
Where This Leaves Us
Survivorship bias is one of those things that feels small until you see how much it can change the story.
A strategy can have smart rules, strong logic, and a great-looking chart. But if the test only includes the winners that survived, the foundation is cracked before the strategy ever starts.
The takeaway isn't complicated.
Before trusting the chart, ask what made it into the data.
More importantly, ask what got left out.
That one question can save you a lot of time, money, and unnecessary screen-staring.
That's why I care about the evidence trail as much as the result.
If you want to dig deeper, the evidence page and backtest guide are where I publish the public record, data notes, and performance context.
The goal isn't to ask readers to trust a chart. The goal is to make the chart easier to question.
I am the founder of Starting Index and have a financial interest in the platform. This article is for informational and educational purposes only and isn't personalized investment advice. Backtests are hypothetical and don't guarantee future results. Investing involves risk, including loss of principal.