
Markets Crash. Your Portfolio Doesn’t Have To.
How to participate, step aside, and re-enter with a simple, rules-based plan

A friend who subscribes to Starting Index recently asked me how the strategy was avoiding market crashes.
His concern went beyond losing money. Would he have to predict a crash and decide when to sell? What if he missed the exit and had to wait through the decline and recovery? And if he got out, how would he know when to return?
The strategy isn't watching for an impending crash. It's watching market conditions and following rules for when to participate, step aside, and return.
It can still lose money. But it gives those decisions a plan before the difficult moment arrives.
I showed him the main backtest graph on Starting Index's Evidence page and pointed out stretches where the strategy's line looked flat while the market was falling. I explained that these were periods when the strategy's rules called for stepping out of stocks and waiting because market momentum had weakened. He found that explanation especially clear. To him, the ability to step aside felt like a superpower.
The appeal was having a process that didn't require him to predict the future.
The Strategy Includes Waiting
Starting Index is built around momentum. It looks for stocks showing strength and uses that ranking to build a portfolio from the S&P 500.
But picking the strongest stocks is only part of the decision. Even the strongest names in a weak market can be losing ground.
The strategy has a separate check on the broader market. When its rules call for stepping aside, the plan moves away from the normal stock allocation and waits for the conditions required to return.
The aim is to preserve capital when conditions no longer support participating, while keeping a path back into stocks when they do.
Waiting isn't abandoning the strategy. It's an integral part of the strategy. It's a safeguard.
When a storm rolls in, we can be patient and wait for the sun to come back out. The strategy's wait ends when its rules call for returning.
Look at What Happened While It Waited
This graph uses the saved Balanced backtest, keeping its stock holdings and timing while assuming cash earns no interest during the waits. It compares the result with SPY, an ETF tracking the S&P 500. This is hypothetical research, not an account record. The log scale makes proportional changes easier to compare.
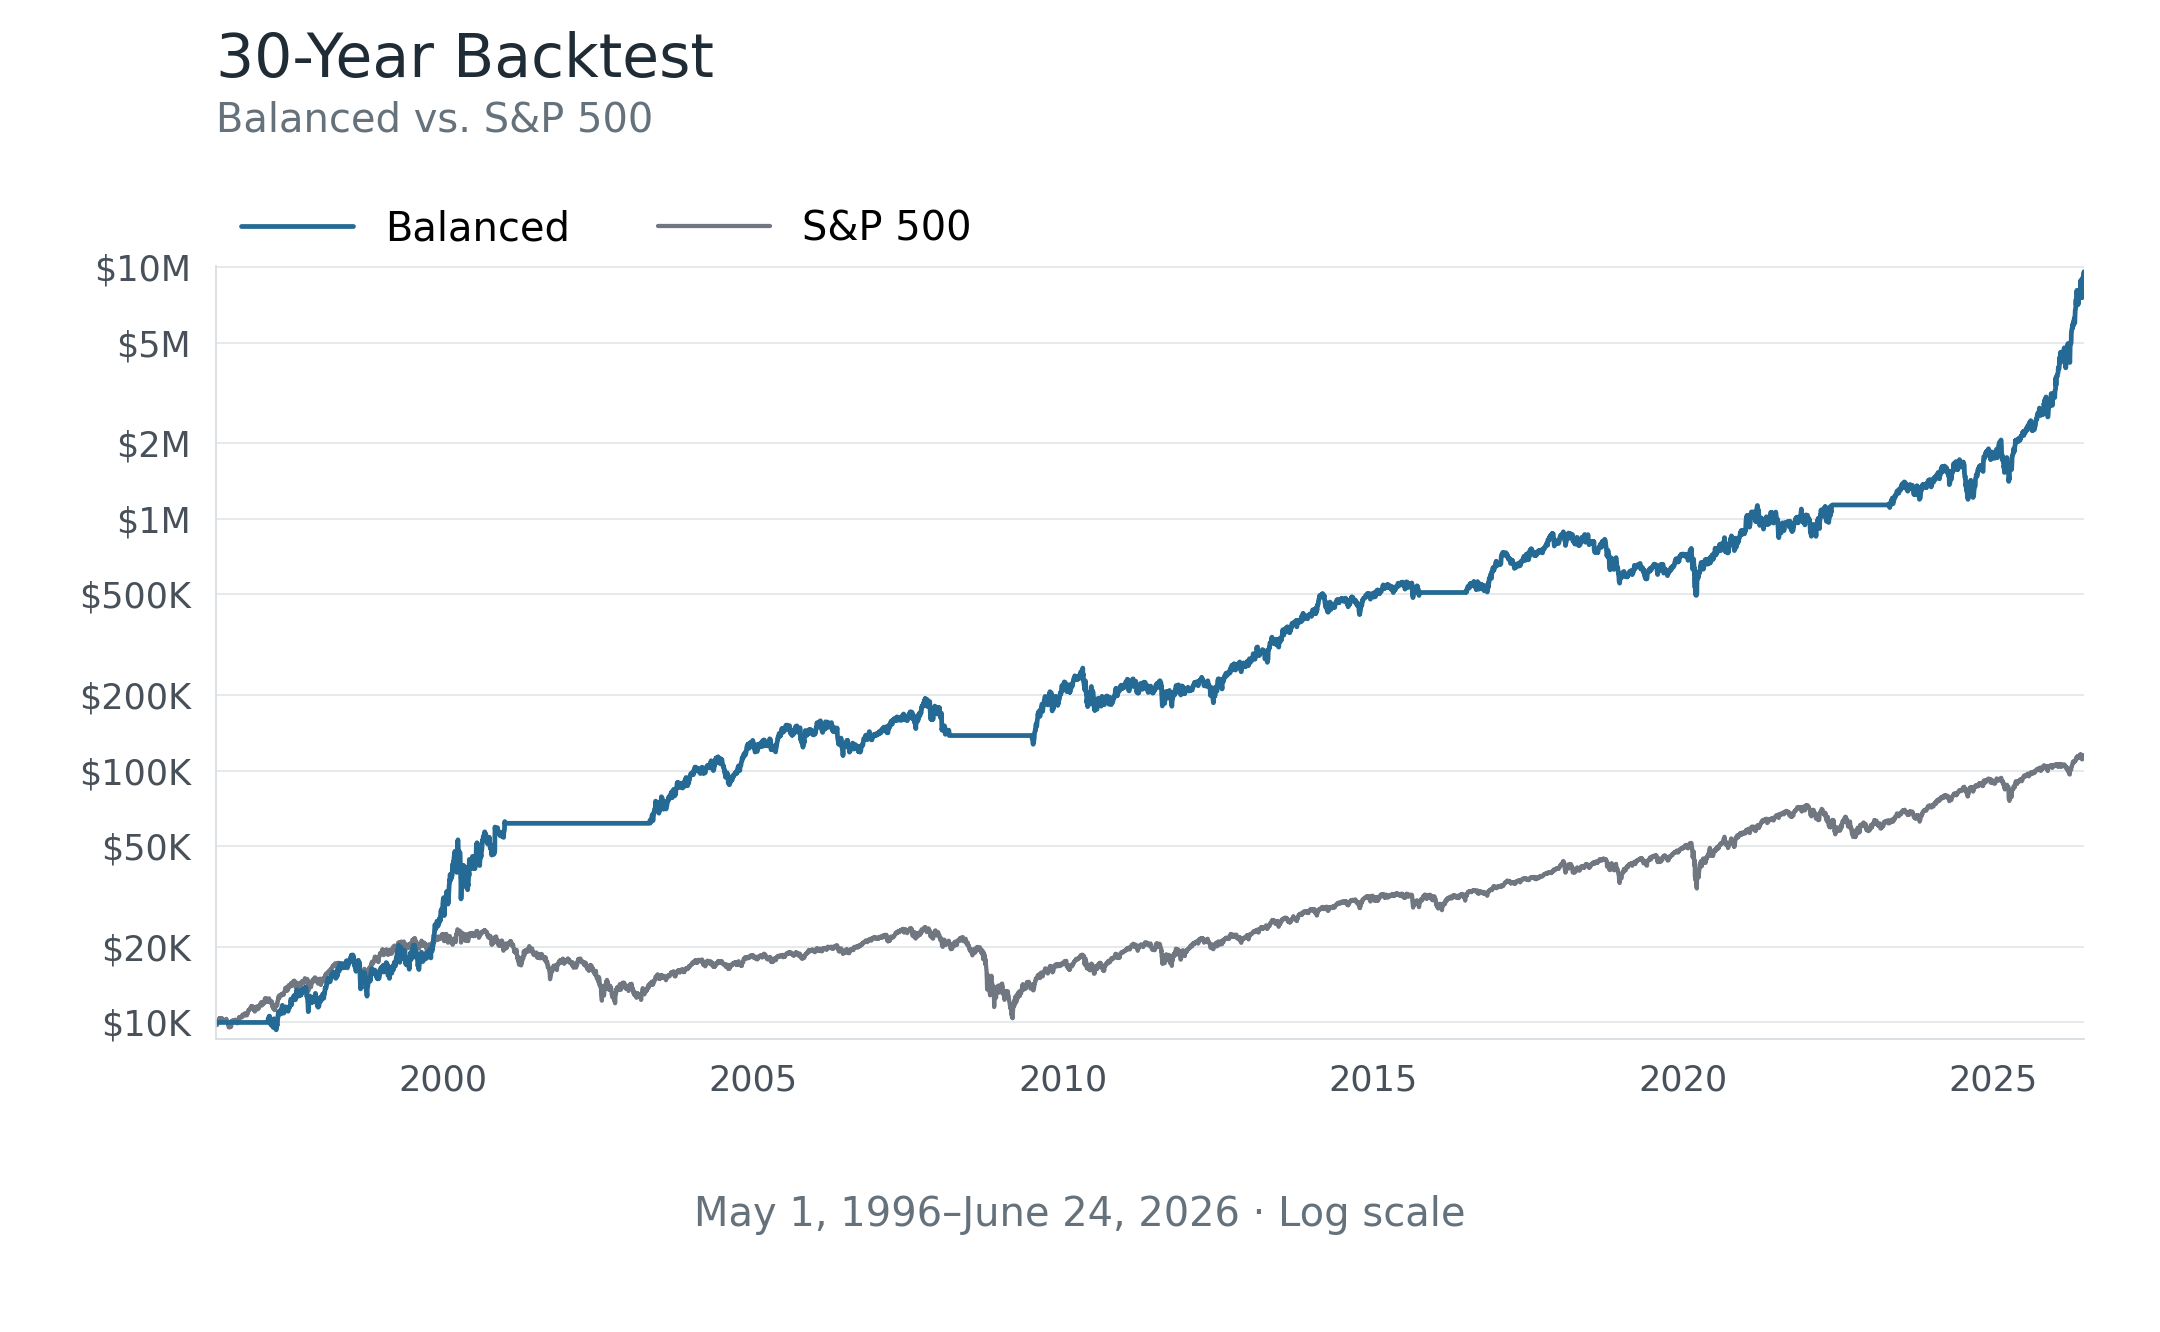
During the dot-com period, the stored simulation moved out of stocks at the December 29, 2000 close. It returned at the April 30, 2003 close, about 28 months later.
Over that same exit-to-return window, the cash version ended essentially flat after modeled stock re-entry costs, while SPY's stored benchmark value fell about 29.9%.
The 2008 example follows the same pattern. The simulation moved out of stocks at the February 29, 2008 close and returned at the June 30, 2009 close, about 16 months later. The cash version again ended essentially flat after modeled stock re-entry costs, while SPY's stored benchmark value fell about 31.3%.
Those comparisons use matching dates, not the market's highest and lowest points. In these two historical periods, waiting helped the simulated portfolio avoid the large losses shown in the benchmark.
The process had a way to spend those stretches outside stocks, then return. The flat sections show that wait under a zero-interest assumption, not a promise that risk disappeared.
Patience Is Part of the Price
Twenty-eight months is a long time to wait. So is sixteen.
When we're used to measuring progress by what our investments are doing, a long stretch on the sidelines can feel like nothing is happening.
These examples give that wait some context. In the simulation, preserving the model's value while the benchmark declined was part of the work.
Waiting didn't always come out ahead. From September 30, 2015 through June 30, 2016, the simulation spent about nine months outside stocks. The cash version ended essentially flat after modeled stock re-entry costs, while SPY gained about 9.3%. The market fell along the way, then recovered before the model returned. Time outside stocks can leave gains behind.
That is the tradeoff. The plan aims to preserve capital and resume participation when conditions support it. It doesn't aim to catch every turn perfectly.
Cash interest or Treasury-bill income may be available, depending on the account and instrument. This illustration assumes neither. Treasury bills have their own terms and risks.
A plan for getting out needs a plan for getting back in.
Follow the Conditions, Not a Prediction
Subscribers receive updated model allocations each month. Losses can happen before an exit, sudden drops can arrive between evaluations, and false signals can lead to unnecessary moves. Trading and taxes can affect real results.
Starting Index publishes the model's direction. Subscribers decide how to implement it in their own accounts.
For me, the benefit is having defined rules for both decisions. I don't have to become a crash forecaster or invent a new reason to return when the news still sounds terrible.
So, do you have to crash with the market?
You can choose an approach whose plan includes stepping aside. That doesn't guarantee protection or make it right for everyone. It gives you a different way to participate, with waiting built into the process.
That's what made the graph useful in the conversation with my friend. We can't know what the market will do next. We can have a plan for how to respond.
You can explore the Evidence page to see the research graph and its supporting context. Look at when the model participated, when it waited, and what brought it back.
I am the founder of Starting Index and have a financial interest in the platform. This article is for informational and educational purposes only and isn't personalized investment advice. Historical research is hypothetical and doesn't guarantee future results. Investing involves risk, including loss of principal.